Research Article | | Peer-Reviewed

Antibacterial and Antioxidant Activities of Cochlospermum planchonii Hook Leaves and White Tips of Agama agama Feces of Korhogo (Côte d’Ivoire)

Received: 30 October 2025     Accepted: 17 November 2025     Published: 20 December 2025
Views:       Downloads:
Abstract

The aim of this study was to evaluate the antibacterial and antioxidant properties of three samples from aqueous extracts of Cochlospermum planchonii leaves and the white tips of Agama agama feces. The phytochemical analyses were carried out by HPLC and spectrophotometric assays. The antioxidant activity was carried out by the DPPH method. As for antibacterial activity, it consisted of determining the inhibition percentage by solid disk diffusion. The Minimum Inhibitory Concentration (MIC) was then determined using the liquid dilution method in sterile test tubes. The phenolic profiles reveal the presence of twelve (12) phenolic compounds identified in the 3 samples E1, E2 and E3. All these phenolic compound showed a significant difference (p ≤ 0.05) when compared with each other. The best antioxidant activity was obtained with sample E2 (80.81 ± 1.36%) compared to vitamin C (59.7 ± 5.11%) used as a reference molecule. Sample E1 gave the best antibacterial activity against the pathogenic strains Stahylococcus aureus (ATCC29213) and Pseudomonas aeruginosa (ATCC27853) with respective MICs of 250 mg/mL and 200 mg/mL. This better efficacy of sample E1 was confirmed by maximum inhibition zones of 14 mm against Pseudomonas aeruginosa and 12 mm against Staphylococcus aureus at the concentration of 500 mg/mL, corresponding to 15.55% and 13% inhibition respectively. This study showed a therapeutic potential of Cochlospermum planchonii and white tips of Agama agama feces as a source of natural antimicrobial and antioxidant agents.

Published in Journal of Diseases and Medicinal Plants (Volume 11, Issue 4)
DOI 10.11648/j.jdmp.20251104.11
Page(s) 113-121
Creative Commons

This is an Open Access article, distributed under the terms of the Creative Commons Attribution 4.0 International License (http://creativecommons.org/licenses/by/4.0/), which permits unrestricted use, distribution and reproduction in any medium or format, provided the original work is properly cited.

Copyright

Copyright © The Author(s), 2025. Published by Science Publishing Group

Keywords

Cochlospermum planchonii, Antioxidant Activity, Antibacterial Activity, Agama agama

1. Introduction
Microbial infections and oxidative stress are global threats to humanity. According to WHO, treatment of infections is becoming increasingly difficult due to the resurgence of resistance of pathogenic bacteria to conventional antibiotics . Apart from the above, oxidative stress, this imbalance between the body's production of antioxidant defenses, is strongly involved in pathogenesis of several metabolic diseases such as cardiovascular and neurodegenerative diseases as well as cancer . This threat requires research for new effective antimicrobial and antioxidant molecules . Faced with these enormous challenges, medicine know-how constitutes an invaluable reservoir of empirical knowledge and potential bioactive substances . Thus, in the North of the Côte d’Ivoire, in Korhogo, populations have developed a rich and diversified pharmacopoeia including medicinal plants and animal products . Among these medicinal plants, Cochlospermum planchonii is widely used to treat infections, gastrointestinal disorders and wounds . These same populations would use white tips of Agama agama feces for its supposed antimicrobial and healing properties . Several parts of Cochlospermum planchonii plant have pharmacological properties (antimicrobial activities, anti-inflammatory and immunomodulatory) according to Karou and his colleagues’ writings . However, Cochlospermum planchonii leaves from Korhogo have not been extensively studied for their antibacterial and antioxidant properties. That is the case of Agama agama white tips of feces whose therapeutic use remains little documented scientific literature. In this perspective, the present study aims to evaluate the antibacterial and antioxidant activities of Cochlospermum planchonii leaves and Agama agama white tips of feces, collected in Korhogo.
2. Material and Methods
2.1. Material
The plant material was consisting of Cochlospermum planchonii leaves (Figures 1A and 1B), collected in Korhogo, as well as white tips of Agama agama feces (Figure 2C). Cochlospermum planchonii leaves were dried and then ground to obtain the powder from which the aqueous extraction was carried out. The white tips of Agama agama feces collected in the places frequented by them such as behind uninhabited houses and also in gutters during the dry season in Korhogo, were rendered into powder (Figure 2D). As for the biological material, it consisted of bacterial strains (Staphylococcus aureus, ATCC29213 and Pseudomans aeruginosa, ATCC27853) procured from the Institut Pasteur of Côte d'Ivoire (IPCI).
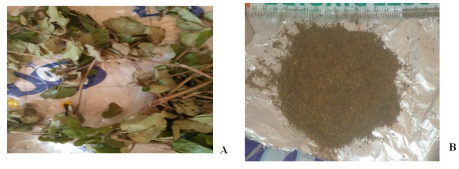
Figure 1. Leaves (A) and Powder (B) of Cochlospermum planchonii.
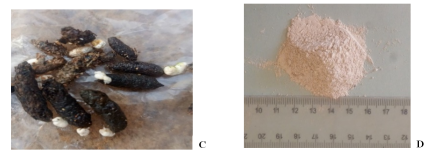
Figure 2. Feces (C) and powder from the white tips (D) of Agama agama.
2.2. Methods
2.2.1. Obtaining Samples E1, E2 and E3
Figure 3 indicates the diagram of Cochlospermum planchonii leaves aqueous extraction according to the method described by Zirihi and his collaborators and taken up by Kouakou .
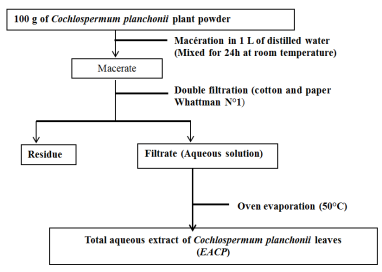
Figure 3. Extraction diagram of Cochlospermum planchonii leaves.
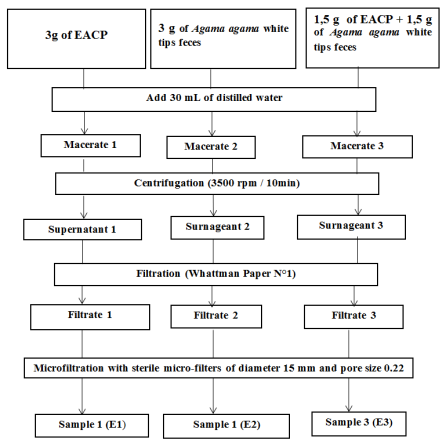
EACP: Aqueous extraction of Cochlospermum planchonii

Download: Download full-size image

Figure 4. Sample collection diagram .
2.2.2. Phytochemical Analysis of Samples
Phenolic profiles of samples E1, E2 and E3
That is a Separation, identification and quantification of phenolic compounds by HPLC. Methanolic extracts of phenolic compounds from the different samples prepared previously (50mL) were diluted in 100 mL of distilled water. Twenty (20) μL of each sample were analyzed using an analytical HPLC unit (Shimadzu Corporation, Japan) equipped of binary pump (LC-6A) coupled to UV-VIS detector (SPD-6A). The phenolics compounds were separated on an ICSep ICE ORH-801 column (length 25 cm) at 30°C. The mobile phase consists of 50 mM NaH2PO4 solution at pH 2.6 (eluent A), acetonitrile/ NaH2PO4 solution (80:20, v/v) (eluent B) and acid 200 mM o-phosphoric acid, pH 1.5 (eluent C). The running time was 70 min with a flow rate of 1 mL/min. The detection wavelength was set at 280 nm. Phenolic compounds of the methanolic extract of samples E1, E2 and E3 were identified by comparison of their retention time with those obtained by the injection of the standard solution containing the standard phenolics compound under the same conditions .
2.2.3. Quantitative Analysis of Polyphenols, Flavonoids and Tannins
1. Quantitative analysis of polyphenols
The method of Singleton and his collaborators is used for total phenols determination. One (1) L of methanolic extract is introduced into test tube. One (1) mL of Folin-ciocalteu reagent is added to the contents of the tube. This tube is left to stand for 3 min and then 1 mL of 20% (w/v) sodium carbonate solution is added. The contents of the tube are made up to 10 mL with distilled water. The tube is placed in the dark for 30 min and the Optical Density (OD) is read at 745 nm against blank. Standard range established from stock solution of gallic acid (1 mg/mL) under the same conditions as the test makes it possible to determine the quantity of polyphenols in the sample. The polyphenol contents were expressed in mg gallic acid equivalent (GAE)/100g of dry matter.
2. Quantitative analysis of flavonoids
The flavonoid assay was carried out according to the method described by Meda and colleagues . A volume of 0.5 mL of methanolic extract was introduced into test tube. 0.5 mL of distilled water, 0.5 mL of aluminum chloride, 0.5 mL of potassium acetate and 2 mL of distilled water were successively added. The tube was left to stand for 30 minutes in the dark and the optical density (OD) was read at 415 nm against blank. A standard range established from a quercetin stock solution (0.1 mg/mL) under the same conditions as the test made it possible to determine the quantity of flavonoids in the sample. The flavonoid contents were expressed in mg of quercetin equivalent (EQ)/100 g of dry matter.
3. Quantitative analysis of tannins
The determination of tannins was carried out according to the method described by Bainbridge and his allies . A (1) mL of methanolic extract is introduced into test tube. To the contents of the tube is added 5 mL of vanillin reagent. The tube is left to stand for 30 min in the dark and the density optical density (OD) is read at 500 nm against blank. The amount of tannins in the samples is determined using standard range established from a stock solution of tannic acid (2 mg/mL) in the same conditions as the test. Tannin contents were expressed in mg acid equivalent tannic acid (ET)/100 g dry matter.
2.2.4. Antioxidant Activities of Samples E1, E2 and E3.
Antioxidant activity is determined according to the method of Choi and his allies . A volume of 2.5 mL of methanolic extract is placed in test tube. To the contents of the tube is added 1 mL of DPPH solution (3 mM in methanol). The tube is placed in the dark for 30 min and the absorbance is read at 415 nm against the blank. A control tube (1 mL of DPPH + 2.5 mL of methanol) is carried out and the absorbance of the tube is read under the same conditions as the test tube. The antioxidant activity of vitamin C (100 µg/mL) used as a reference molecule was carried out under the same conditions as E1, E2 and E3. Antioxidant activity is expressed as percentage inhibition of DPPH as follows:
AA%=DOc-DOe-DObX100DOc
DOc: absorbance of the control tube
DOe: absorbance of the test tube
DOb: absorbance of the white or control tube
2.2.5. Antibacterial Activities of Samples 1, 2 and 3
1. Antibacterial activity by solid disc diffusion
The inoculum of Staphylococcus aureus or Pseudomonas aeruginosa is first inoculated using of a sterile loop on Mueller Hinton (MH) medium around the Bunsen burner flame. Then, the sterile discs impregnated with decreasing concentrations (500 mg/mL, 450 mg/mL, 400 mg/mL, 350 mg/mL, 300 mg/mL, 250mg/mL, 200mg/mL, 150mg/mL, 100mg/mL, 50mg/mL, 10mg/mL) of samples E1, E2 and E3 at a rate of 10µL per disc, were deposited sterile using forceps on the surface of the MH agar. Finally, the dishes are incubated at 37°C for 24h. At the end of the incubation time, the inhibition diameters are measured using a ruler and the inhibition percentages are calculated according to the following formula. Antibiotic discs for positive controls, consisting of penicillin and Ticarcillin successively for Staphylococcus aureus and Pseudomonas aeruginosa were placed in the center of each MH agar plate. For the negative control, a sterile Whattman No. 1 disc was soaked in distilled water .
Pourcentage dinhibition %=DtestDdish X 100
-Dtest: Inhibition diameter
-Ddish: Diameter of the Petri dish
2. Antibacterial activity in liquid medium
The objective of this method is to determine the minimum inhibitory concentration (MIC) of samples E1, E2 and E3 the lowest concentration capable of inhibiting any growth bacterial visible after 24 hours of incubation. The method used is based on a dilution in liquid medium in sterile test tubes. A series of prepared tubes, containing 4 mL of sterile nutrient broth to which 50 µL is added samples E1, E2 and E3 at different concentrations (500 mg/mL, 450 mg/mL, 400 mg/mL, 350 mg/mL, 300 mg/mL, 250 mg/mL, 200 mg/mL, 150 mg/mL, 100 mg/mL and 50 mg/mL dissolved in distilled water). Twenty (20) µL of suspension was then added to each of the tubes standardized bacterial. A growth control tube was also prepared; it contains only nutrient broth (4 mL), 50 µL of distilled water (without extract) and 20 µL of the suspension of Staphylococcus aureus or Pseudomonas aeruginosa. This witness made it possible to check the viability of the strain in the absence of an antibacterial agent. All tubes were then incubated at 37°C for 24 hours. At the end of this period, the results are analyzed visually: the presence of turbidity in the medium indicates bacterial growth, then that a clear medium indicates total inhibition of growth.
3. Results
3.1. Profile of Phenolic Components of Samples
Table 1 shows the phenolic profiles of samples 1, 2 and 3. Twelve (12) phenolics compounds were identified in the 3 samples E1, E2 and E3.
1. Sample 1
Quercetin had the highest mean concentration (1831 ± 0.001 µg/mL), followed by caffeic acid (1113 ± 0.001 µg/mL) and chlorogenic acid (324.1 ± 0.001 µg/mL). We note also notable amount of p-coumaric acid (108.2 ± 0.001 µg/mL). The lowest was the catechin with 16.18 ± 0.001 µg/mL.
2. Sample 2
Concerning E2, the gallic acid concentration which is 21.70 ± 0.001 µg/mL is close to that of protocatechuic acid (21.16 ± 0.001 µg/mL), while caffeic acid (10.14 ± 0.001 µg/mL is much less abundant compared to other phenolic compounds. Quercetin remains predominant (1765 ± 0.001 µg/mL).
3. Sample 3
This sample is distinguished by very high average concentration of caffeic acid (1916 ± 0.001 µg/mL), far exceeding chlorogenic acid (324.3 ± 0.001 µg/mL) and quercetin (1650 ± 0.001 µg/mL). The analyses reveal that the three samples E1, E2 and E3 present phenolic profiles similar with different concentrations of phenolic compounds.
Table 1. Profile of phenolic components of samples E1, E2 and E3.

Phenolic compounds

E1

E2

E3

Gallic acid (µg/mL)

21.54 ± 0.002a

21.70 ± 0.001b

20.74 ± 0.001c

Protocatechuic acid (µg/mL)

21.55 ± 0.001a

21.16 ± 0.001b

19.80 ± 0.001c

Catechin (µg/mL)

16.18 ± 0.001a

15.34 ± 0001b

14,44 ± 0,001c

Chlorogenic acid (µg/mL

324.1 ± 0.001a

321.2 ± 0.001b

324.3 ± 0.001c

Cafeic acid (µg/mL)

1113 ± 0.001a

1014 ± 0.001b

1916 ± 0.001c

Pcoumaric acid (µg/mL)

108.2 ± 0.001a

106.1 ± 0.001b

105.3 ± 0.001c

Homoorientine (µg/mL)

184.1 ± 0.001a

18.01 ± 0.001b

171.5 ± 0.001c

Rutin (µg/mL)

25.37 ± 0.001a

27.37 ± 0.001b

25.42 ± 0001c

Quercetin-G (µg/mL)

57.65 ± 0.001a

58.11 ± 0.001b

56.03 ± 0.001c

Quercetin-dH (µg/mL)

54.71 ± 0.001a

51.75 ± 0.001b

53.77 ± 0.001c

Cinnamic acid (µg/mL)

3.241 ± 0.001a

3.277 ± 0.001b

3.277 ± 0.001c

Quercetin (µg/mL)

1831 ± 0.001a

1765 ± 0.001b

1650 ± 0.001c

Each value is the average of three trials. Different letters in the same row indicate a statistical difference (p ˂ 0.05).
3.2. Polyphenol, Flavonoid, Tannin Contents and Antioxidant Activity of Samples
E1, E2 and E3
The Table 2 presents the concentrations of polyphenols, flavonoids, tannins and the antioxidant activity of the three samples (E1, E2 and E3). Sample E1 has the highest concentrations of polyphenols (832.2 ± 0.40 mg EAG/100g of DM) and flavonoids (315.2 ± 0.09 mg EQ/100g DM), associated with an activity significant antioxidant (61.24 ± 6.16%). Its tannin content was 51.33 ± 0.64 mg ET/100g of DM). Concerning sample E2, despite a low polyphenol content (744.1 ± 0.22 mg EAG/100g of DM), it displays the best antioxidant activity (80.81 ± 1.36%). It contains a very low tannin content (0.84 ± 0.08 mg ET/100g of DM). As for E3, it shows an intermediate profile, with moderate levels of polyphenols (799.2 ± 0.43 µg/mL) and flavonoids (302.9 ± 0.12 µg/mL). Its antioxidant activity was 57.98 ± 4.25% with a tannin content of 8.57 ± 0.84 mg ET/100g of DM.
Table 2. Bioactive compound contents and antioxidant activity of the samples E1, E2, E3.

Samples

Polyphenols (mg EAG/100g of DM)

Tannins (mg ET/100g of DM)

Flavonoids (mg EQ/100g of DM)

Antioxidant activity (%)

E1

832.2 ± 0.40a

51.33 ± 0.64a

315.2 ± 0.09a

61.24 ± 6.16ns

E2

744.1 ± 0.22b

0.8400 ± 0.08b

295.0 ± 0.4195b

80.81 ± 1,36*

E3

799.2 ± 0.43c

8.567 ± 0.84c

302.9 ± 0.12c

57.98 ± 4.25ns

Vitamin C

59.7 ± 5.11

Each value is the average of three trials. Different letters in the same column indicate a statistical difference (p ˂ 0.05); *: Significant difference at p ˂ 0.05; DM: Dry Matter
3.3. Percentage of Disc Inhibition
The results are shown in Figure 5 A and B and Figure 6 C and D. Figures 5A and 6C show that there is no inhibition zone around the sample-impregnated discs E1, E2 and E3 apart from the antibiotics Penicillin and Ticarcillin. The inhibition zones were observed with samples E1 and E3 in the case of the range of concentration between 300 mg/mL and 500 mg/mL (Figure 5B and 6D); the sample E1 developed the highest inhibition zones of 14 mm (15.55% inhibition) and 12mm (i.e. 13% inhibition) at a concentration of 500mg/mL successively against Pseudomonas aeruginosa and Staphylococus aureus. The highest inhibition percentages E3 levels were 11.11% against Staphylococus aureus and 10% against Pseudomonas aeruginosa (Table 3). The lowest inhibition percentages were obtained with sample E3 at concentration of 300mg/mg/mL (6.67% for Staph a. and 7.78% for Pseudo a.).
3.4. Minimal Inhibitory Concentration (MIC)
The Figures 5 and 6 show the antibacterial activity of sample E1 on Staphylococcus aureus and Pseudomonas aeruginosa germs. This method of diluting the sample E1 tested at different concentrations on the Staph aureus strain showed that there is an inhibitory activity from the dose 250 mg/mL for this sample (Figure 5). As for the Pseudo aeruginosa. strain, it was inhibited by E1 at from 200mg/mL by the same sample (Figure 6).
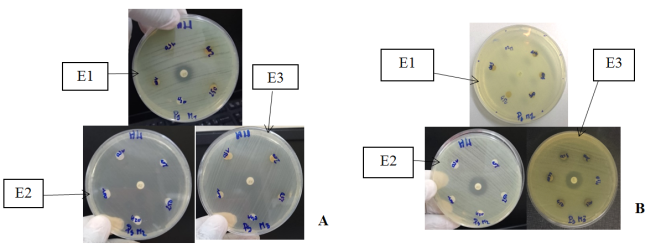
Figure 5. Photographs showing the inhibition zones of samples E1, E2 and E3 against Pseudomonas aeruginosa with a concentration range of 100 mg/mL to 250 mg/mL (A) and concentration range of 300 mg/mL to 500 mg/mL (B).
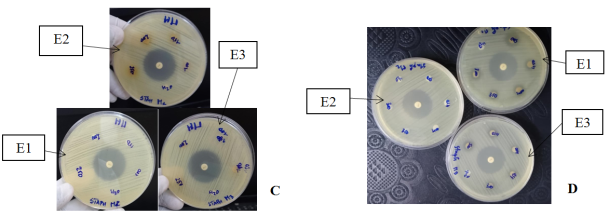
Figure 6. Photographs showing the inhibition zones of samples E1, E2 and E3 against Staphylococcus aureus with concentration range of 100 mg/mL to 250 mg/mL (C) and concentration range of 300 mg/mL to 500 mg/mL (D).
Table 3. Responses of Pseudomonas aeruginosa and Staphylococcus aureus strains to E1, E2 and E3 samples tested.

Diameters/Percentages of inhibition

Samples

Sample concentrations (mg/mL)

300

350

400

450

500

E

Pe

Tir

Staph a.

D (mm)

E1

7

9

10

12

14

0

29

-

P (%)

7.78

10

11.11

13.33

15.55

0

32.22

-

D (mm)

E3

6

7

7

9

10

0

29

-

P (%)

6.67

7.78

7.78

10.0

11.11

0

3.22

-

Pseudo a.

D (mm)

E1

10

10

11

11

12

0

-

15

P (%)

11.11

11.11

12.22

12.22

13.33

0

-

16.67

D (mm)

E3

7

7

8

8

9

0

-

15

P (%)

7.78

7.78

8.89

8.89

10.0

0

-

16.67

Staph a.: Staphylococcus aureus
Pseudo a.: Pseudomonas aeruginosa
P: Pourcentage of inhibition; D: Diameter
4. Discussion
Phytochemical analysis of the three samples E1, E2 and E3 shows the presence of twelve phenolic compounds including gallic acid, quercetin, catechin, caffeic acid in varying proportions. The presence of these phenolic compounds would give these samples formulated based on Cochlospermum planchonii, biological activities remarkable. All three samples have strong antioxidant activity that varies between 57.98 ± 4.25% and 80.81 ± 1.36% lower than the antioxidant activity of vitamin C which is 51.11 ± 4.2%. These results show that E1 and E2 have strong antioxidant activity despite that they are not pure like ascorbic acid. The antioxidant activity of samples E1 and E3 is justified by the high amount of caffeic acid in both samples (1113 ± 0.001 µg/mL for M1 and 1916± 0.001 µg/mL for M3). Indeed, caffeic acid is an excellent natural antioxidant that neutralizes free radicals and protects cells from oxidative stress . Quercetin (1650 to 1831µg/mL) and its derivatives such as quercetin-G, Quercetin-dH also has content high in the three (03) samples. Quercetin is a flavonoid that has strong potential antioxidant capable of neutralizing free radicals . Catechins even though that they are less abundant in the samples compared to caffeic acid and quercetin would contribute significantly to the expression of antioxidant activity. For as for sample E2, the presence of phenolic compounds could be linked to the diet food of tips which is made up of leaves and crickets and certainly other compounds that were not identified in this study. This shows that the efficacy antioxidant depends not only on the total amounts, but also on the chemical nature, the bioavailability of the compounds and the low tannin content (0.84 mg ET/100g DM), which could limit inhibitory interactions. Furthermore, this proves that the antioxidant activity is not correlated with the content of tannins but with their structure . These observations confirm the results of Wang and his allies , who found extracts rich in polyphenols (850 µg/mL), tannins (45 µg/mL) and flavonoids (310 µg/mL) associated with activity moderate antioxidant (60%). As for flavonoids, their content remains in the same range in samples E1 (295 mg EQ/100g DM) and E3 (315 mg EQ/100g DM); this is what would explain the moderate antioxidant activity of these two samples . The results obtained in this study revealed antibacterial activity, only E1 and E3 samples tested on Staphylococcus aureus strains and Pseudomonas aeruginosa, using disk and liquid diffusion methods. Sample E1 showed the best efficacy, with maximum inhibition zones of 14 mm against P. aeruginosa and 12 mm against S. aureus at a concentration of 500 mg/mL, corresponding to 15.55% and 13% inhibition respectively. This antibacterial activity of sample E1 could be explained by the high content of caffeic acid. This phenolic compound exerts antibacterial activity by disrupting the cell membrane of bacteria and inhibiting their growth. This antibacterial activity could also be justified by the high quercetin content in samples E1 and E3. These compounds inhibit the synthesis nucleic acids in bacteria. This biological activity is enhanced by the presence in these samples phenolic acids such as gallic acid, chlorogenic acid and protocatechuic acid . The results obtained are consistent with those reported by Djipa and his colleagues , who observed inhibition zones ranging from 10 to 15 mm for crude plant extracts against S. aureus. Similarly, Nguelefack and his colleagues have highlighted similar antibacterial activities from medicinal plant extracts Cameroonian plants such as Entada africana, Ficus asperifolia and Anogeissus leiocarpa . Sample E3, on the other hand, showed lower antibacterial activity, with a maximum inhibition percentage of 11.11% against S. aureus and 10% against P. aeruginosa. Which could be due either to a lower concentration of bioactive compounds or to a lower extraction efficiency in this specific case. The results also indicate that P. aeruginosa, often recognized for its resistance to conventional antibiotics, has been relatively sensitive to samples, especially to E1. This is similar to the results of Hassan and his allies , who noted an inhibition of 13 mm with extracts of Azadirachta indica at 500 mg/mL. Also, the comparison with standard antibiotics made it possible to situate the effectiveness of samples formulated from extracts of Cochlospermum planchonii tested. The inhibition zones obtained for E1 remain lower than those of Penicillin (32.22%) and Ticarcillin (16.67%), but remain significant for samples formulated from crude extracts. Indeed, according to Kavitha and her colleagues, an inhibition greater than 10% is considered promising in preliminary studies on plant extracts . Concerning the liquid medium method, the MIC obtained in the case of E1 was 250 mg/mL against S. aureus and 200 mg/mL against P. aeruginosa. This finding corroborates the work of El Astal and his collaborators, who have pointed out that certain extracts are more active in solution due to better diffusion of active compounds .
5. Conclusion
Analyses carried out on extracts from the leaves of Cochlospermum planchonii and Agama agama white tips have highlighted a strong antioxidant potential. This antioxidant activity depends on phenolic compounds contents, flavonoids but also the chemical nature of these metabolites and their interactions. Sample E2 from the white tips of Agama agama had the strongest antioxidant activity. Furthermore, the antibacterial activity results reveal significant efficacy for Cochlospermum planchonii extract against Staphylococcus aureus and Pseudomonas aeruginosa. Although the observed inhibitions are lower than those of antibiotics standards used; these results remain promising for crude extracts and support the hypothesis of use in phytotherapy. In perspective, additional investigations aimed at the isolation, identification and valorization of the active principles responsible for these biological activities will be carried out.
Abbreviations

HPLC

High Performance Liquip Chromatography

NaH2PO4

Monosodium Phosphate

AA

Antioxidant Activity

OD

Optical Density

Author Contributions
Kouakou Yeboue Koffi Francois: Conceptualization, Data curation, Investigation, Methodology, Resources, Writing - original draft, Writing - review & editing
Kouame Yao Yves: Conceptualization, Data curation, Methodology, Resources, Writing - review & editing
Miezan Bile Aka Patrice: Data curation, Formal Analysis, Software, Resources, Writing - review & editing
Sene Mbaye: Supervision, Data curation, Formal Analysis
Tia Vama Etienne: Supervision, Writing - review & editing
Yapi Houphouet Felix: Supervision, Writing - review & editing
Conflicts of Interest
The authors declare no conflicts of interest.
References
[1] World Health Organization. Global Antimicrobial Resistance and Utilization Surveillance System (GLASS) Report: 2021. Geneva: WHO.
[2] Phaniendra A, Jestadi DB, Periyasamy L. (2015). Free radicals: properties, sources, targets, and their implications in various diseases. Indian Journal of Clinical Biochemistry, 30(1), 11–26.
[3] Ventola, C. L. The antibiotic resistance crisis: Part 1: Causes and threats. P&T: Peer-Reviewed Journal for Forms Management. 2015; 40(4), 277–283.
[4] Lobo V, Patil A, Phatak A, Chandra N. Free radicals, antioxidants, and functional foods: impact on human health. Pharmacognosy Reviews. 2010; 4(8), 118-126.
[5] Abdullahi AA. Trends and challenges of traditional medicine in Africa. African Journal of Traditional, Complementary and Alternative Medicines. 2011; 8(5S), 115-123.
[6] Tra Bi FH, Irié GM, N'gaman KCC, Mohou CHB. (2008). Studies of some therapeutic plants used in the treatment of hypertension and diabetes: two emerging diseases in Côte d'Ivoire. Sciences & Nature. 2008; 5(1), 39-48.
[7] Nacoulma OG. Medicinal plants and traditional medical practices in Burkina Faso: The case of the central plateau [Doctoral dissertation]. University of Ouagadougou, 1996.
[8] Dossou VM, Agbankpé AJ, Hounzangbé-Adoté MS, Sinsin BA. Veterinary use of animal products in the treatment of animal diseases in Benin. International Journal of Biological and Chemical Sciences. 2012; 6(6), 2821-2829.
[9] Karou D, Savadogo A, Canini A, Yameogo S, Montesano C, Simpore J, Colizzi V, Traore AS. Antibacterial activity of Sida acuta alkaloids. African Journal of Biotechnology. 2007; 5(2), 195-200.
[10] Zirihi GN, Mambu L, Guede-Guina F, Bodo B, Grellier PJ. In vitro antiplasmodial activity and cytotoxicity of 33 West African plants used for treatment of malaria. Journal of Ethnopharmacology. 2005; 98(3) 281–285 p.
[11] Kouakou YKF. Evaluation of the anti-inflammatory, antioxidant, and analgesic activities of aqueous and ethanolic extracts of Trema guineensis (Ulmaceae) in the Wistar rat (Rattus norvegicus). Doctoral thesis, Felix Houphouet Boigny University, Abidjan, 145 p. 2016.
[12] Soumahoro KP. Antibiotic and antioxidant activities of aqueous extracts of Cochlospermum planchonii Hook F. leaves, supplemented with Agama agama feces. Master, Peleforo GON COULIBALY University, Korhogo, Cote d’Ivoire, 2025.
[13] Singleton VL, Orthofer R, Raventos RM. Analysis of total phenols and other oxydant substrates and antioxydants by means of Folin-ciocalteu reagent. Methods Enzymol, 1999; 299: 152-178 p.
[14] Meda A, Lamien CE, Romito M, Millogo J, Nacoulma OG. Determination of total phenolic, flavonoid and proline contents in Burkina Faso honeys as well as well as their radical scavenging activity. Food. Chem., 2005; 91: 571-577 p.
[15] Bainbridge Z, Tomlins K, Westby A. Analysis of condensed tannins using acidified vanillin. J. Food Sci. Agric., 1996; 29: 77-79 p.
[16] Choi CW, Kim SC, Hwang SS, Choi BK, Ahn HJ, Lee MZ, Park SH, Kim SK. Antioxydant activity and free radical scavenging capacity between Korean medicinal plant and flavonoids by assay guided comparaison. Plant Sci., 2002; 163: 1161-1168 p.
[17] Lambert RJW, Pearson J. Susceptibilitytesting: accurate and reproducible minimum inhibitory concentration (NIC) values. Journal of Applied Microbiology, 2000; 88(5), 784-790.
[18] Genaro-Mattos TC, Maurio AQ, Rettori D, Alonso A, Hermes-Lima M. Antioxidant activity of caffeic acid against iron-induced Free Radical Generation. A chemical approach. PLoS One, 2015; 10(6), 2015.
[19] David AVA, Arulmoli R, Parasuraman S. Overviews of biological importance of quercetin: a bioactive flavonoid. Pharmacognosy Reviews, 2016; 10(20), 84-89.
[20] Wang L, Zhang Y, Li J. Polyphenol composition and antioxidant activity: A comparative study. Journal of Natural Products, 2019; 82(3), 456–467 p.
[21] Cushnie TPT, Lamb AJ. Antimicrobial activity of flavonoids. International Journal of Antimicrobial Agents, 2005; 26(5), 343–356 p.
[22] Djipa Y, Kouassi K, Kone M. Antioxidant activity of hydroethanolic extracts of C. planchonii (roots), DPPH method. Ivorian Research Bulletin. 2000; 18, 45–52 p.
[23] N’guelfack. Bioflavonoids classification, pharmacological, biochemical effects and therapeutic potential. Indian Journal of Pharmaceutical. 2005; 33: 2–16 p.
[24] Hassan L, Mohamed, El-Hakim A. Comparison of the antioxidant and antibacterial activities of leaf and root extracts of C. planchonii. Journal of Natural Remedies, 2006; 6(1): 10–16 p.
[25] Kavitha D, Viji M, Kalaiselvi M. (2013). Antibacterial activity of plant extracts against clinical pathogens: A preliminary study. Journal of Medicinal Plants Research, 2013; 7(15), 882 p.
[26] El Astai A, Rahmani M, Khayri J. Extraction and antioxidant evaluation of C. planchonii extracts (hydroethanol). Middle East Journal of Medicinal Plants Research, 2005; 4(12): 1234–1240 p.
Cite This Article
  • APA Style

    Francois, K. Y. K., Yves, K. Y., Patrice, M. B. A., Mbaye, S., Etienne, T. V., et al. (2025). Antibacterial and Antioxidant Activities of Cochlospermum planchonii Hook Leaves and White Tips of Agama agama Feces of Korhogo (Côte d’Ivoire). Journal of Diseases and Medicinal Plants, 11(4), 113-121. https://doi.org/10.11648/j.jdmp.20251104.11

    Copy | Download

    ACS Style

    Francois, K. Y. K.; Yves, K. Y.; Patrice, M. B. A.; Mbaye, S.; Etienne, T. V., et al. Antibacterial and Antioxidant Activities of Cochlospermum planchonii Hook Leaves and White Tips of Agama agama Feces of Korhogo (Côte d’Ivoire). J. Dis. Med. Plants 2025, 11(4), 113-121. doi: 10.11648/j.jdmp.20251104.11

    Copy | Download

    AMA Style

    Francois KYK, Yves KY, Patrice MBA, Mbaye S, Etienne TV, et al. Antibacterial and Antioxidant Activities of Cochlospermum planchonii Hook Leaves and White Tips of Agama agama Feces of Korhogo (Côte d’Ivoire). J Dis Med Plants. 2025;11(4):113-121. doi: 10.11648/j.jdmp.20251104.11

    Copy | Download

  • @article{10.11648/j.jdmp.20251104.11,
      author = {Kouakou Yeboue Koffi Francois and Kouame Yao Yves and Miezan Bile Aka Patrice and Sene Mbaye and Tia Vama Etienne and Yapi Houphouet Felix},
      title = {Antibacterial and Antioxidant Activities of Cochlospermum planchonii Hook Leaves and White Tips of Agama agama Feces of Korhogo (Côte d’Ivoire)},
      journal = {Journal of Diseases and Medicinal Plants},
      volume = {11},
      number = {4},
      pages = {113-121},
      doi = {10.11648/j.jdmp.20251104.11},
      url = {https://doi.org/10.11648/j.jdmp.20251104.11},
      eprint = {https://article.sciencepublishinggroup.com/pdf/10.11648.j.jdmp.20251104.11},
      abstract = {The aim of this study was to evaluate the antibacterial and antioxidant properties of three samples from aqueous extracts of Cochlospermum planchonii leaves and the white tips of Agama agama feces. The phytochemical analyses were carried out by HPLC and spectrophotometric assays. The antioxidant activity was carried out by the DPPH method. As for antibacterial activity, it consisted of determining the inhibition percentage by solid disk diffusion. The Minimum Inhibitory Concentration (MIC) was then determined using the liquid dilution method in sterile test tubes. The phenolic profiles reveal the presence of twelve (12) phenolic compounds identified in the 3 samples E1, E2 and E3. All these phenolic compound showed a significant difference (p ≤ 0.05) when compared with each other. The best antioxidant activity was obtained with sample E2 (80.81 ± 1.36%) compared to vitamin C (59.7 ± 5.11%) used as a reference molecule. Sample E1 gave the best antibacterial activity against the pathogenic strains Stahylococcus aureus (ATCC29213) and Pseudomonas aeruginosa (ATCC27853) with respective MICs of 250 mg/mL and 200 mg/mL. This better efficacy of sample E1 was confirmed by maximum inhibition zones of 14 mm against Pseudomonas aeruginosa and 12 mm against Staphylococcus aureus at the concentration of 500 mg/mL, corresponding to 15.55% and 13% inhibition respectively. This study showed a therapeutic potential of Cochlospermum planchonii and white tips of Agama agama feces as a source of natural antimicrobial and antioxidant agents.},
     year = {2025}
    }
    

    Copy | Download

  • TY  - JOUR
    T1  - Antibacterial and Antioxidant Activities of Cochlospermum planchonii Hook Leaves and White Tips of Agama agama Feces of Korhogo (Côte d’Ivoire)
    AU  - Kouakou Yeboue Koffi Francois
    AU  - Kouame Yao Yves
    AU  - Miezan Bile Aka Patrice
    AU  - Sene Mbaye
    AU  - Tia Vama Etienne
    AU  - Yapi Houphouet Felix
    Y1  - 2025/12/20
    PY  - 2025
    N1  - https://doi.org/10.11648/j.jdmp.20251104.11
    DO  - 10.11648/j.jdmp.20251104.11
    T2  - Journal of Diseases and Medicinal Plants
    JF  - Journal of Diseases and Medicinal Plants
    JO  - Journal of Diseases and Medicinal Plants
    SP  - 113
    EP  - 121
    PB  - Science Publishing Group
    SN  - 2469-8210
    UR  - https://doi.org/10.11648/j.jdmp.20251104.11
    AB  - The aim of this study was to evaluate the antibacterial and antioxidant properties of three samples from aqueous extracts of Cochlospermum planchonii leaves and the white tips of Agama agama feces. The phytochemical analyses were carried out by HPLC and spectrophotometric assays. The antioxidant activity was carried out by the DPPH method. As for antibacterial activity, it consisted of determining the inhibition percentage by solid disk diffusion. The Minimum Inhibitory Concentration (MIC) was then determined using the liquid dilution method in sterile test tubes. The phenolic profiles reveal the presence of twelve (12) phenolic compounds identified in the 3 samples E1, E2 and E3. All these phenolic compound showed a significant difference (p ≤ 0.05) when compared with each other. The best antioxidant activity was obtained with sample E2 (80.81 ± 1.36%) compared to vitamin C (59.7 ± 5.11%) used as a reference molecule. Sample E1 gave the best antibacterial activity against the pathogenic strains Stahylococcus aureus (ATCC29213) and Pseudomonas aeruginosa (ATCC27853) with respective MICs of 250 mg/mL and 200 mg/mL. This better efficacy of sample E1 was confirmed by maximum inhibition zones of 14 mm against Pseudomonas aeruginosa and 12 mm against Staphylococcus aureus at the concentration of 500 mg/mL, corresponding to 15.55% and 13% inhibition respectively. This study showed a therapeutic potential of Cochlospermum planchonii and white tips of Agama agama feces as a source of natural antimicrobial and antioxidant agents.
    VL  - 11
    IS  - 4
    ER  - 

    Copy | Download

Author Information
  • Department of Biochemistry-Genetics, Peleforo GON COULIBALY University, Korhogo, Côte d’Ivoire

  • Department of Biochemistry-Genetics, Peleforo GON COULIBALY University, Korhogo, Côte d’Ivoire

  • Department of Biochemistry-Genetics, Peleforo GON COULIBALY University, Korhogo, Côte d’Ivoire

  • Department of Pharmacy, Cheick Anta Diop University, Dakar, Senegal

  • Department of Biochemistry-Genetics, Peleforo GON COULIBALY University, Korhogo, Côte d’Ivoire

  • Department of Health Biology, Felix Houphouet-Boigny University, Abidjan, Côte d’Ivoire